I have finished my Master’s thesis titled “Dimensionality Reduction with Neighborhood Embeddings.” In it, we derive a framework for expressing various modern visualization algorithms as parameters on a spectrum.
The most important candidates are t-SNE, UMAP, FA2, and LE. The Figure summarizes the main finding of the paper:
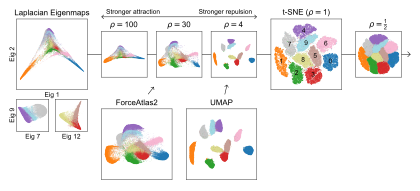
The figure can be seen in the full thesis as Figure 5.1. The dataset used is the well-known MNIST handwritten digit dataset. It’s used to demonstrate the example, but we have used plenty more examples where the same effect can be observed.
Observe the similarity between t-SNE with and the visualization produced by UMAP. Furthermore, look at the similarity between FA2 and t-SNE with . The resemblance of each other is (to our knowledge) novel and has not yet been explored. Nevertheless, there are ample examples of those three algorithms being used in the applied sciences, especially within the transcriptomic community. That means that many people are using those algiorithms without understanding why the visualizations turn out the way they do.
The MSc thesis provides (i) an experimental verification of the claims laid out visually and (ii) gives explanations for the links between UMAP and as well as FA2 and . The work presented is also available as a preprint, called “A Unifying Perspective on Neighbor Embeddings along the Attraction-Repulsion Spectrum.”
The two sentence summary for the results is: UMAP introduces a bias by optimizing its loss via negative sampling. FA2 produces a “more exaggerated” layout because its attractive force does not decay with the distance in the low-level embedding.